Creating and Launching a Reddit Clone Application with an Improved DevSecOps Pipeline Integrated with Monitoring and Logging.


Table of contents
- Introduction:
- Overview:
- Project Resources:
- Step1: Create IAM User
- Step2: Aws Configuration
- Step3: Terraform for provisioning Jenkins, sonarQube, and Trivy in EC2 Instance
- Step 4: Install Plugins like JDK, Sonarqube Scanner, NodeJs, and OWASP Dependency Check
- 4B: Configure Java and Nodejs in Global Tool Configuration
- Step 5: Configure Sonar Server in Manage Jenkins
- Step 6: Install OWASP Dependency Check Plugins
- Step 7: Docker Image Build and Push
- Step 8: Creation of EKS Cluster with Terraform and ArgoCD Setup
- Step 9: Install Helm & Monitoring K8S using Prometheus and Grafana.
- Step 10: Installation of logging on K8S using ElasticSearch, Fluentd and Kibana.
- Conclusion:
Introduction:
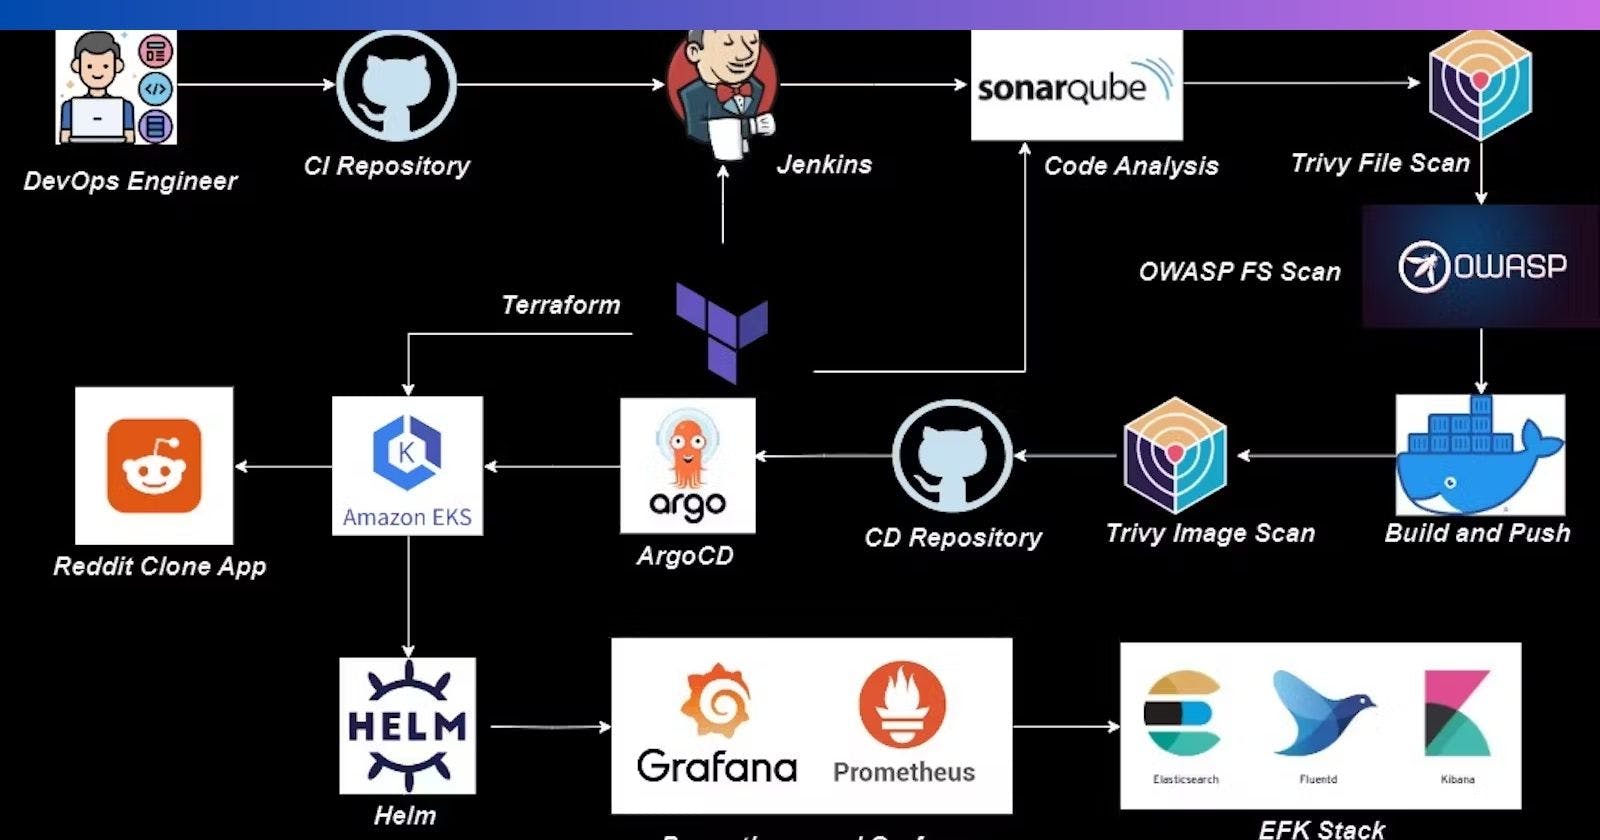
This project aims to automate the deployment of a cloud-native infrastructure using Terraform and AWS, with a specific focus on leveraging the Elastic Kubernetes Service (EKS). The implementation of continuous integration and delivery (CI/CD) will be carried out through Jenkins and ArgoCD, ensuring seamless and efficient deployments.
To enhance the security of the infrastructure, a variety of tools will be employed. SonarQube and OWASP will be utilized for static code analysis and vulnerability scanning, respectively. Trivy will be employed for container image scanning to detect any vulnerabilities present in the container images.
For monitoring and observability, Prometheus will serve as the monitoring and alerting system, complemented by Grafana for visualization and dashboards. The log management and analysis aspect will involve the use of Elasticsearch, Fluentd, and Kibana (EFK stack), enabling centralized logging and efficient log searching.
In summary, this project will exemplify the seamless integration and utilization of these tools, resulting in a secure and scalable cloud-native infrastructure with robust monitoring and observability capabilities.
Overview:
This project aims to deploy a Reddit clone application in a cloud-native environment while incorporating monitoring and logging functionalities. The implementation will leverage the following tools:
1. Terraform: An Infrastructure as Code (IAC) tool for automating the deployment of the application’s infrastructure on AWS.
2. AWS: A cloud platform providing essential services and resources for hosting the application.
3. EKS (Elastic Kubernetes Service): A managed Kubernetes service on AWS designed for container orchestration, established using the IAC tool Terraform.
4. Jenkins: A Continuous Integration/Continuous Deployment (CI/CD) tool automating the build, test, and deployment processes.
5. SonarQube: A static code analysis tool ensuring code quality and identifying potential issues.
6. Trivy: A container image vulnerability scanner used to detect and mitigate security risks in the application’s containers.
7. OWASP: The Open Web Application Security Project, offering a set of best practices for web application security.
8. ArgoCD: A Continuous Deployment tool managing and automating deployments to the EKS cluster.
9. Prometheus: A monitoring and alerting system collecting metrics and generating alerts based on predefined rules.
10. Grafana: A visualization and dashboard tool displaying monitoring data in a user-friendly manner.
11. Elasticsearch: A distributed search and analytics engine for storing and indexing logs.
12. Fluentd: A log collector and forwarding agent aggregating and forwarding logs to Elasticsearch.
13. Kibana: A data visualization and exploration tool for analyzing logs stored in Elasticsearch.
Project Resources:
GitHub Link:
github.com/mudit097/Reddit-Clone-apps — CI (Source Code)
github.com/mudit097/Reddit-Argocd CD (Manifest file code)
github.com/mudit097/AWS-EKS-TF Terraform for EKS.
github.com/mudit097/EFK-Stack — EFK Stack Deployment.
Step1: Create IAM User
Navigate to the AWS console
Create an IAM user with administration access.
Log in to the AWS Console with the above user.
Create one free-tier EC2 instance with Ubuntu.
Login to the EC2 instance and follow the below steps.
Step2: Aws Configuration
Install the AWS Cli in your EC2 Ubuntu.
Install AWS CLI:
curl "https://awscli.amazonaws.com/awscli-exe-linux-x86_64.zip" -o "awscliv2.zip"
unzip awscliv2.zip
sudo ./aws/install
aws --version
aws configure (Configure your Access and Secret key)
Step3: Terraform for provisioning Jenkins, sonarQube, and Trivy in EC2 Instance
Terraform Installation in an EC2 Instance:
wget https://releases.hashicorp.com/terraform/1.3.7/terraform_1.3.7_linux_amd64.zip
unzip terraform_1.3.7_linux_amd64.zip
mv terraform /usr/local/bin
sudo mv terraform /usr/local/bin
terraform -v
resource "aws_instance" "web" {
  ami                    = "ami-0fc5d935ebf8bc3bc"   #change ami id for different region
  instance_type          = "t2.large"
  key_name               = "Reddit"
  vpc_security_group_ids = [aws_security_group.Jenkins-sg.id]
  user_data              = templatefile("./install.sh", {})

  tags = {
    Name = "Jenkins-sonarqube-trivy-vm"
  }

  root_block_device {
    volume_size = 30
  }
}

resource "aws_security_group" "Jenkins-sg" {
  name        = "Jenkins-sg"
  description = "Allow TLS inbound traffic"

  ingress = [
    for port in [22, 80, 443, 8080, 9000, 3000] : {
      description      = "inbound rules"
      from_port        = port
      to_port          = port
      protocol         = "tcp"
      cidr_blocks      = ["0.0.0.0/0"]
      ipv6_cidr_blocks = []
      prefix_list_ids  = []
      security_groups  = []
      self             = false
    }
  ]

  egress {
    from_port   = 0
    to_port     = 0
    protocol    = "-1"
    cidr_blocks = ["0.0.0.0/0"]
  }

  tags = {
    Name = "jenkins-sg"
  }
}
#provider.tf

terraform {
  required_providers {
    aws = {
      source  = "hashicorp/aws"
      version = "~> 5.0"
    }
  }
}

# Configure the AWS Provider
provider "aws" {
  region = "us-east-1"  #change your region
}
#!/bin/bash
sudo apt update -y
wget -O - https://packages.adoptium.net/artifactory/api/gpg/key/public | tee /etc/apt/keyrings/adoptium.asc
echo "deb [signed-by=/etc/apt/keyrings/adoptium.asc] https://packages.adoptium.net/artifactory/deb $(awk -F= '/^VERSION_CODENAME/{print$2}' /etc/os-release) main" | tee /etc/apt/sources.list.d/adoptium.list
sudo apt update -y
sudo apt install temurin-17-jdk -y
/usr/bin/java --version
curl -fsSL https://pkg.jenkins.io/debian-stable/jenkins.io-2023.key | sudo tee /usr/share/keyrings/jenkins-keyring.asc > /dev/null
echo deb [signed-by=/usr/share/keyrings/jenkins-keyring.asc] https://pkg.jenkins.io/debian-stable binary/ | sudo tee /etc/apt/sources.list.d/jenkins.list > /dev/null
sudo apt-get update -y
sudo apt-get install jenkins -y
sudo systemctl start jenkins
sudo systemctl status jenkins

#install docker
sudo apt-get update
sudo apt-get install docker.io -y
sudo usermod -aG docker ubuntu
newgrp docker
sudo chmod 777 /var/run/docker.sock
docker run -d --name sonar -p 9000:9000 sonarqube:lts-community

#install trivy
sudo apt-get install wget apt-transport-https gnupg lsb-release -y
wget -qO - https://aquasecurity.github.io/trivy-repo/deb/public.key | gpg --dearmor | sudo tee /usr/share/keyrings/trivy.gpg > /dev/null
echo "deb [signed-by=/usr/share/keyrings/trivy.gpg] https://aquasecurity.github.io/trivy-repo/deb $(lsb_release -sc) main" | sudo tee -a /etc/apt/sources.list.d/trivy.list
sudo apt-get update
sudo apt-get install trivy -y
Terraform commands to provision:
terraform init
terraform validate
terraform plan
terraform apply --auto-approve
The EC2 instance Jenkins-sonarqube-trivy-vm is created by Terraform with Jenkins, Sonarqube, and Trivy as userdata for the EC2 instance, which is installed during the creation of the EC2 instance.
Take the public IP address of the EC2 instance, as shown in the below image.
Public IPV4 address>:8080. #For accessing Jenkins
sudo cat /var/lib/jenkins/secrets/initialAdminPassword
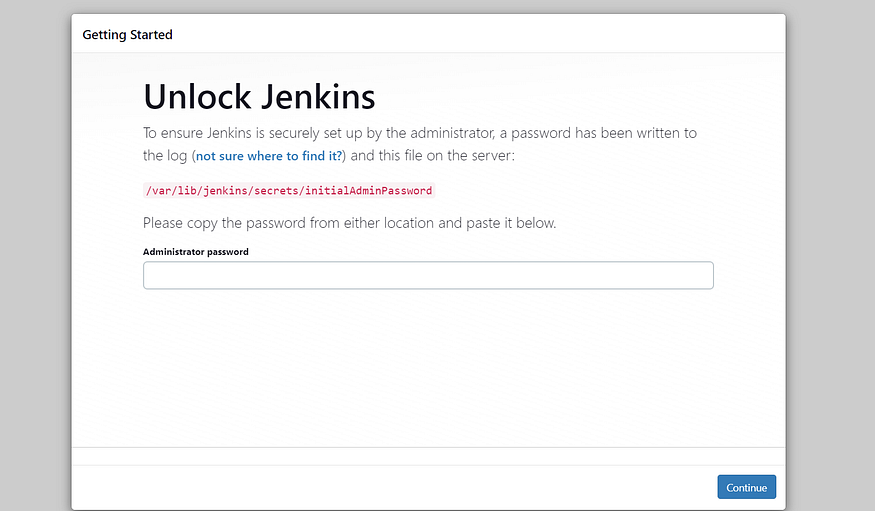
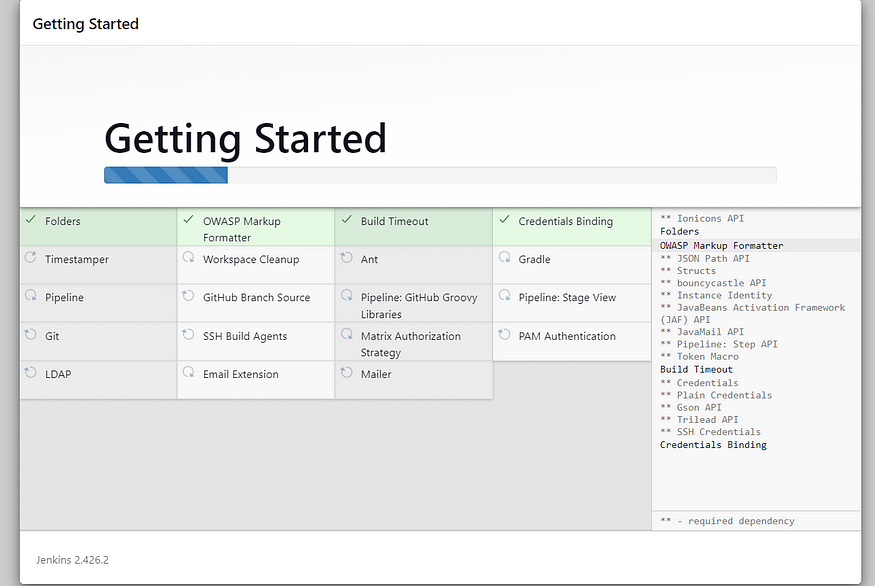
Unlock Jenkins using an administrative password and install the suggested plugins.
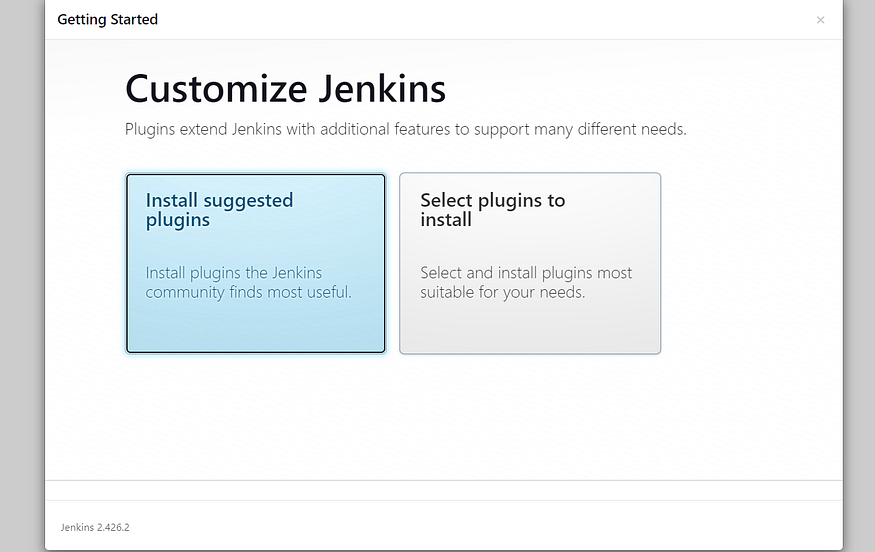
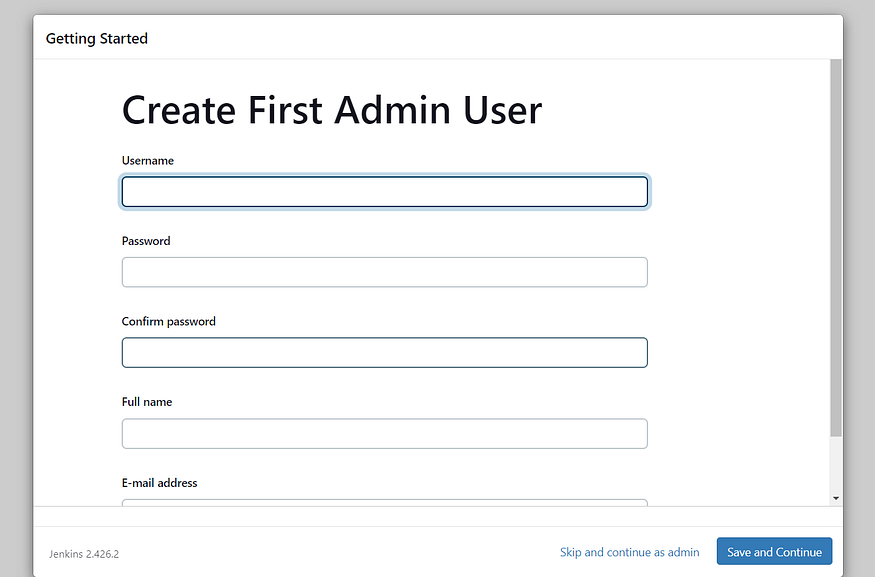
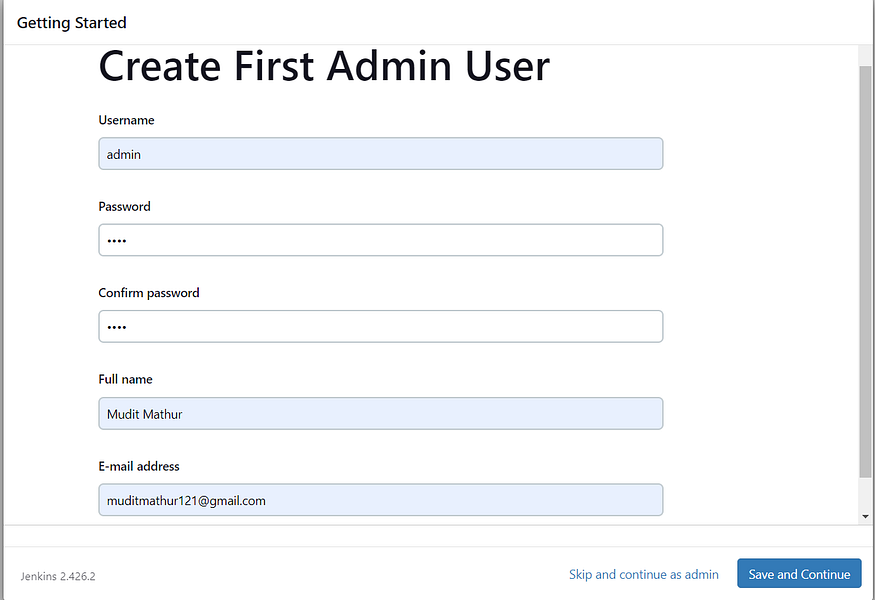
Create a user, click save, and continue.
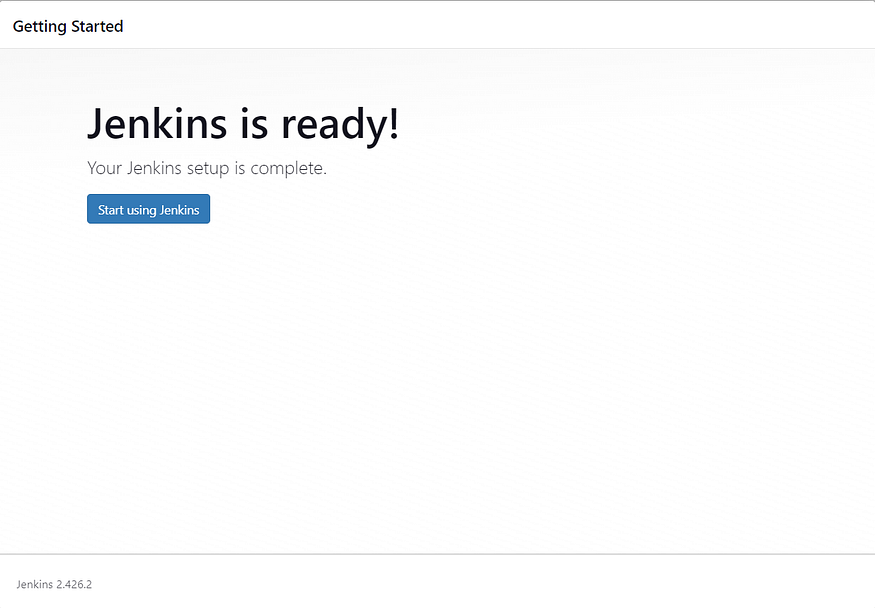
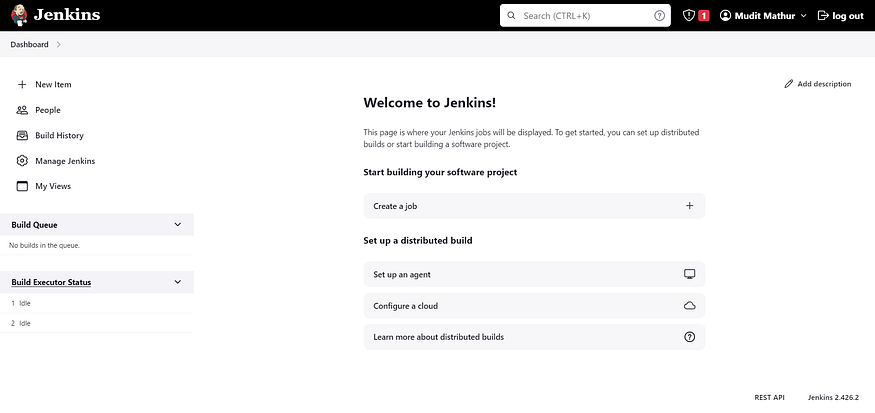
Jenkins Getting Started Screen.
Check Sonarqube container in EC2 Instance
The sonarqube we provisioned in an EC2 instance using Terraform in a Docker container.
<Public IPV4 address>:9000. #For accessing Sonarqube
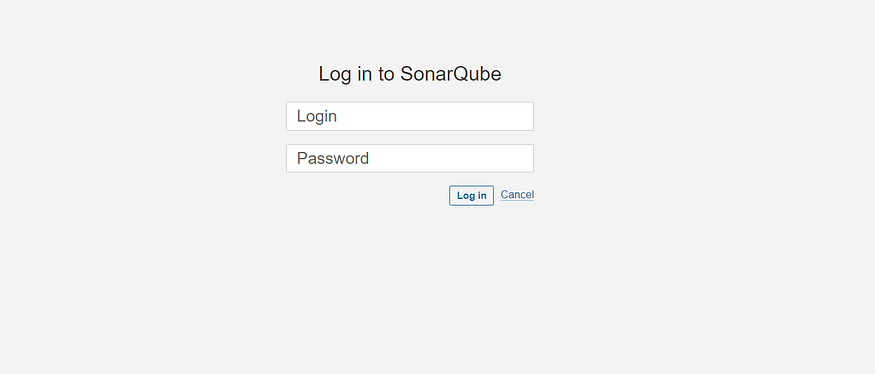
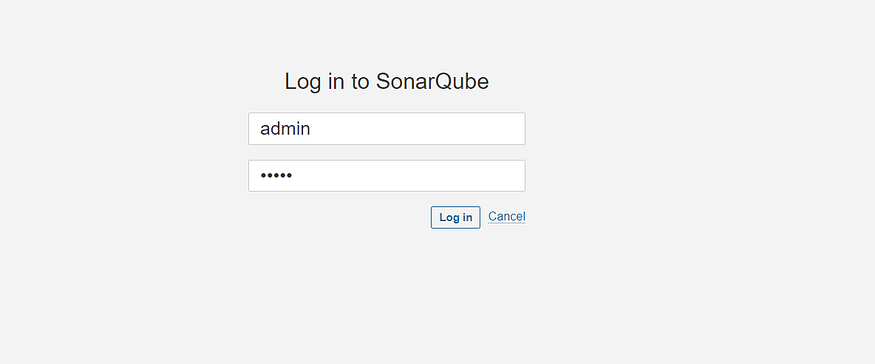
Enter your username and password, click on login, and change your password.
username admin
password admin
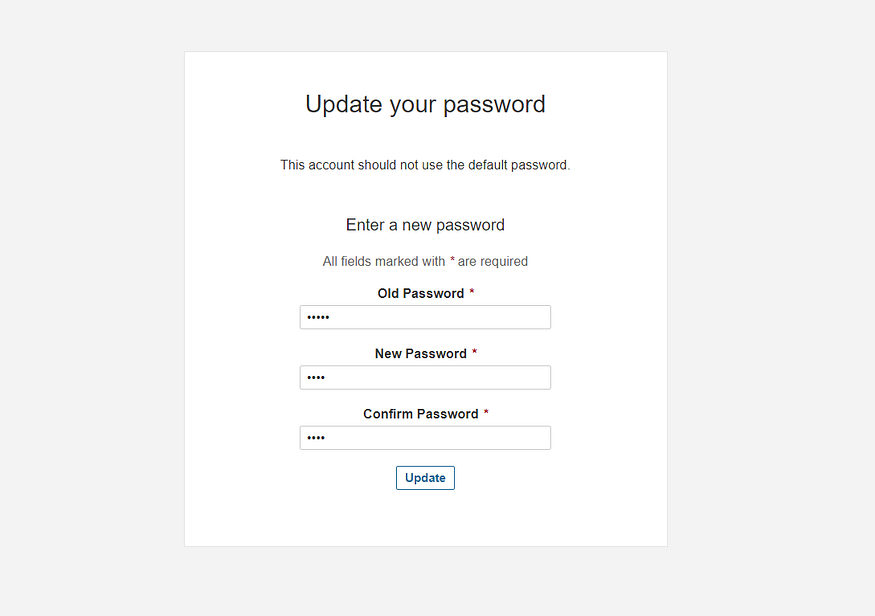
Update the new password. This is the Sonar Dashboard, as shown below.

Check Trivy version
Check the Trivy version in an Ec2 instance.
Step 4: Install Plugins like JDK, Sonarqube Scanner, NodeJs, and OWASP Dependency Check
Goto Manage Jenkins →Plugins → Available Plugins
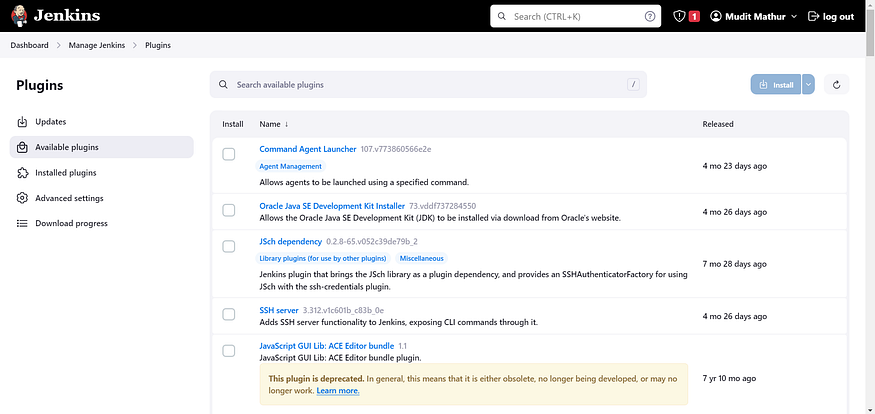
Install below plugins
1: Eclipse Temurin Installer (Install without restart)
2: SonarQube Scanner (Install without restart)
3: Sonar Quality Gates (Install Without restart)
4: Nodejs (Without restart)

4B: Configure Java and Nodejs in Global Tool Configuration
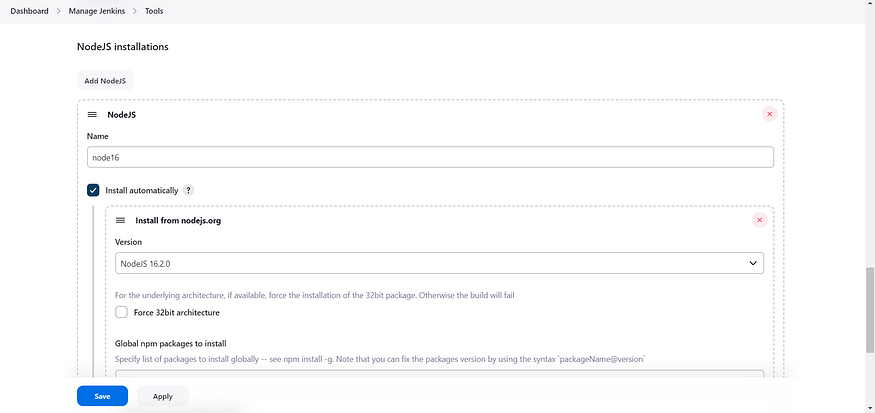
Goto Manage Jenkins → Tools → Install JDK (17) and NodeJs (16). Click on Apply and Save
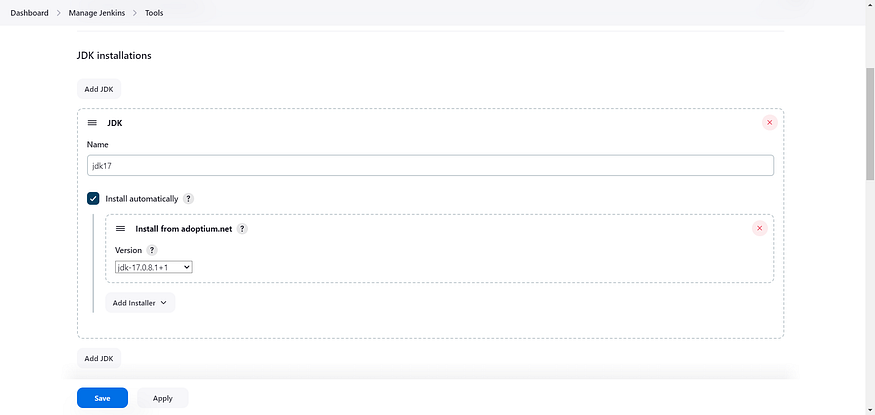
Choose the option install from adoptium.net
Step 5: Configure Sonar Server in Manage Jenkins
Grab the public IP address of your EC2 instance.
Sonarqube works on Port 9000, so <Public IP>:9000.
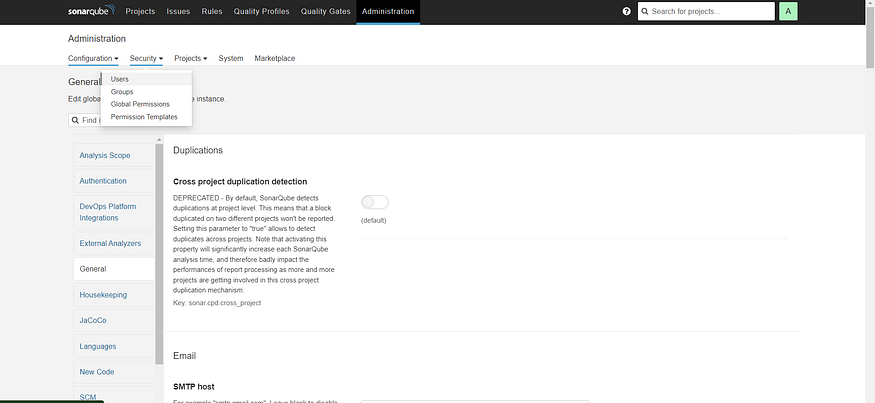
Go to your Sonarqube server.
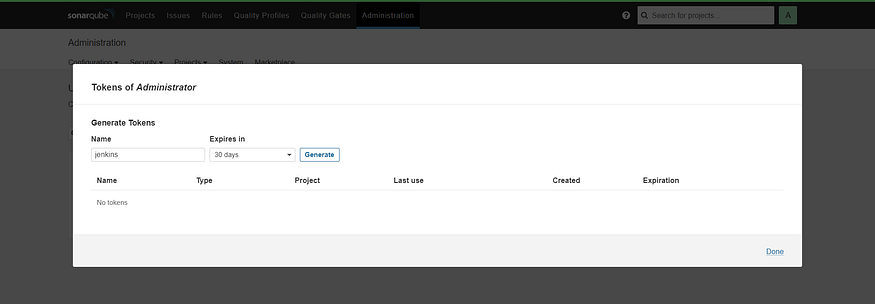
Click on Administration → Security → Users → Click on Tokens and Update Token, → Give it a name, and click on Generate Token
click on update Token
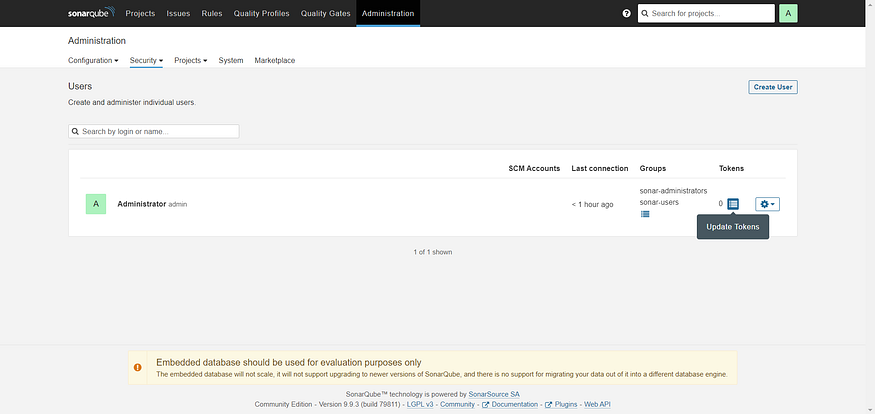
Create a token with a name and generate
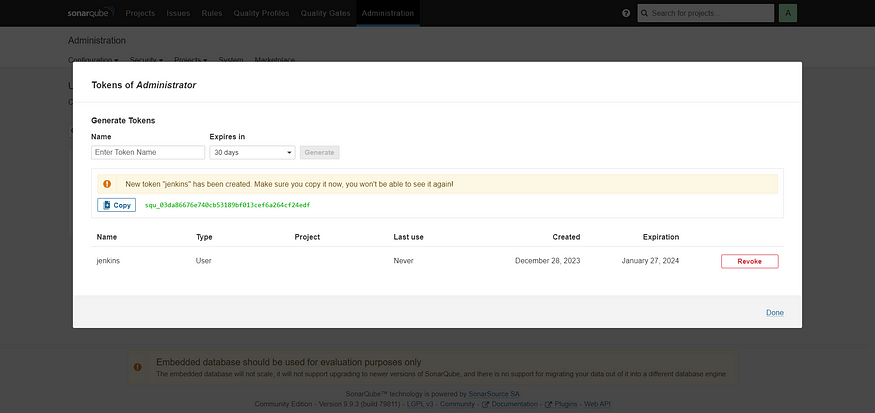
copy Token
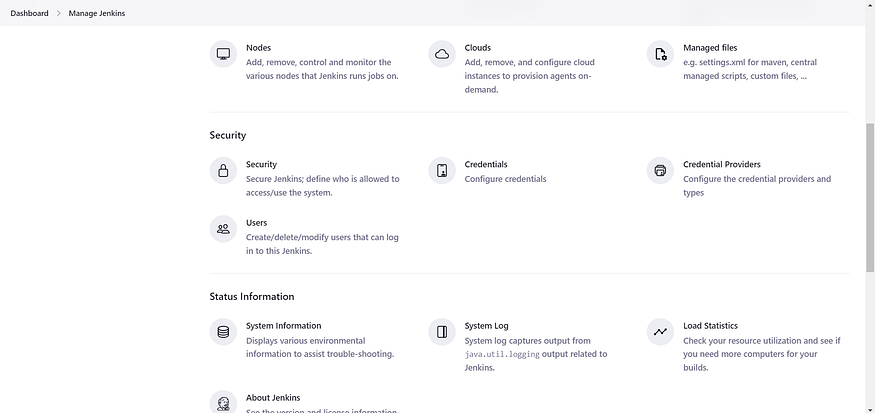
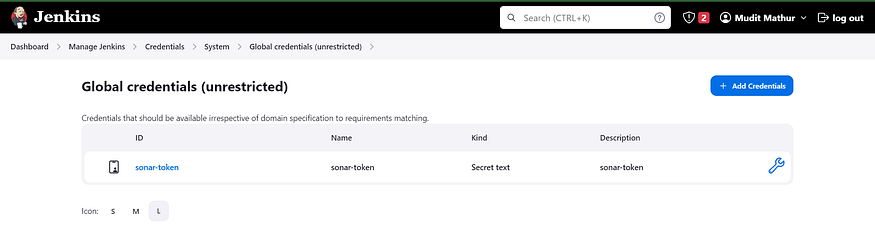
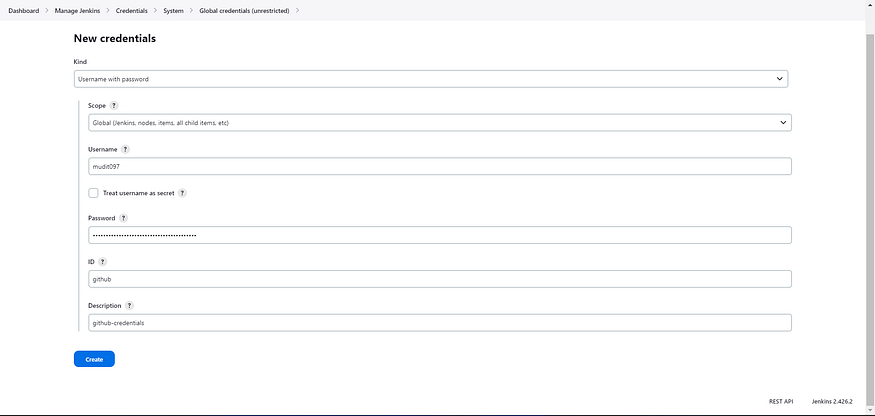
Goto Jenkins Dashboard → Manage Jenkins → Credentials → Add secret text. It should look like this
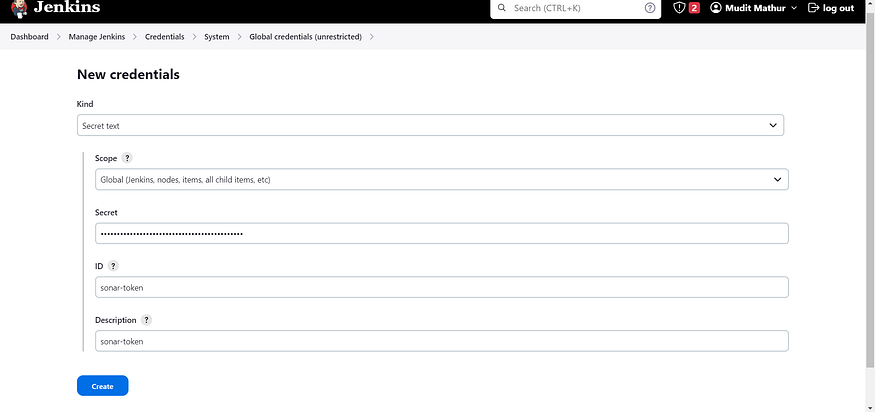
You will see this page once you click on create
Now, go to Dashboard → Manage Jenkins → System and add something like the below image. Copy the private IP address of the instance as well.
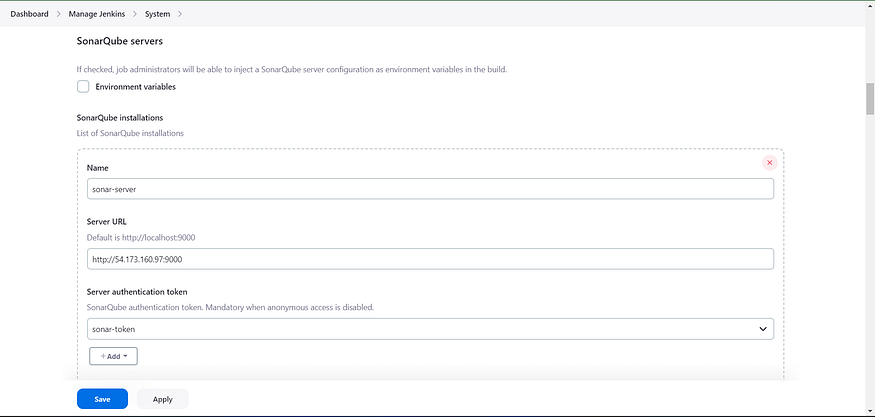
Click on Apply and Save.
The Configure System option is used in Jenkins to configure different server
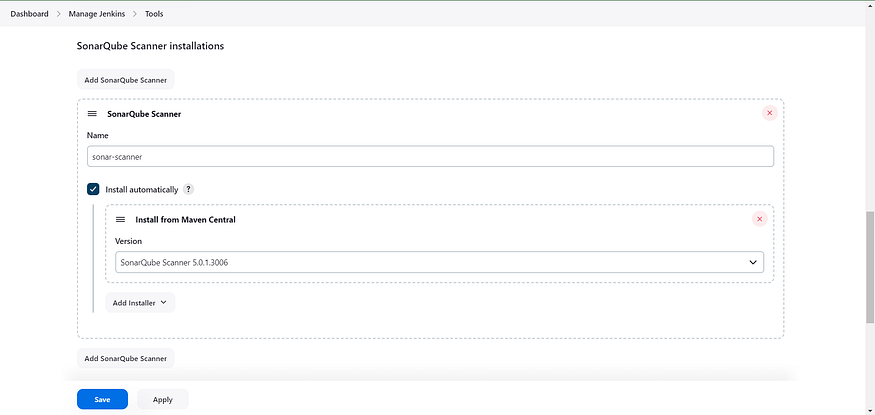
Global Tool Configuration is used to configure different tools that we install using Plugins
We will install a sonar scanner in the tools.
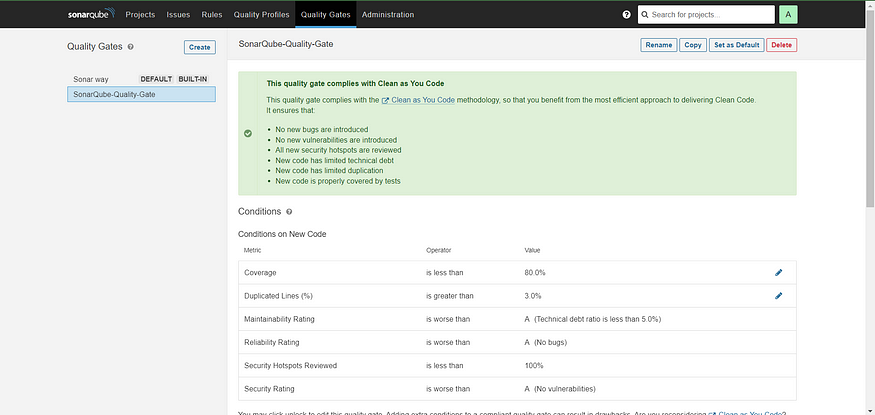
In the Sonarqube Dashboard, add a quality gate as well.
In the sonar interface, create the quality gate as shown below:
Click on the quality gate, then create.

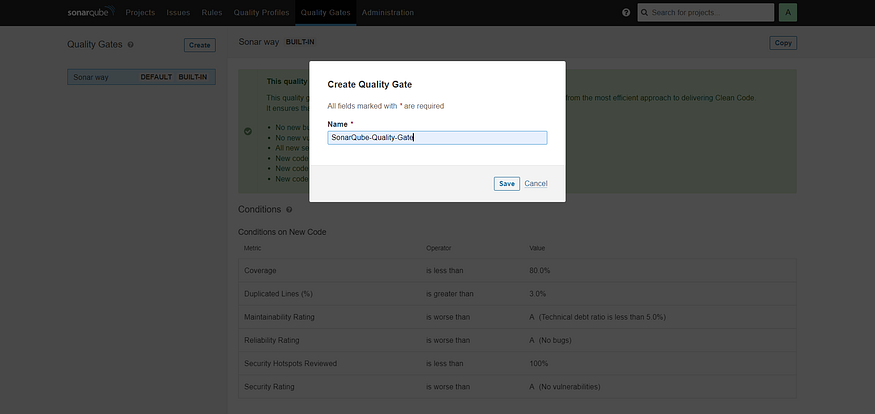
Click on the save option.
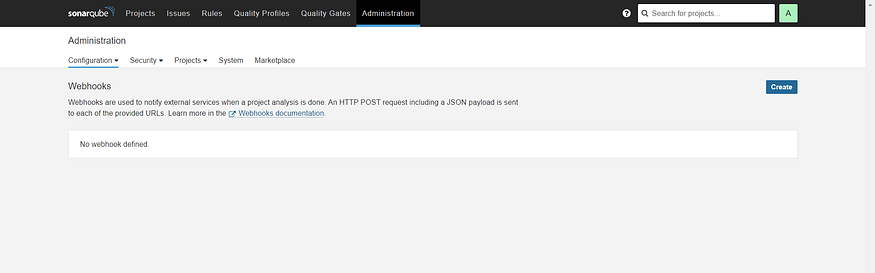
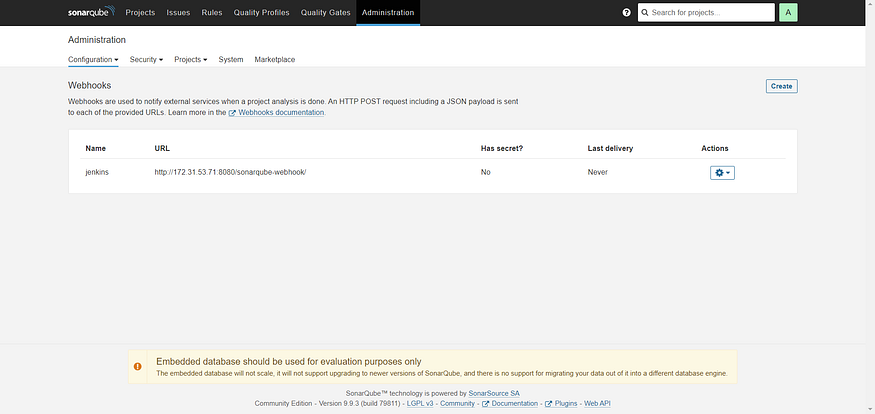
In the Sonarqube Dashboard, Create Webhook option as shown in below:
Administration → Configuration →Webhooks
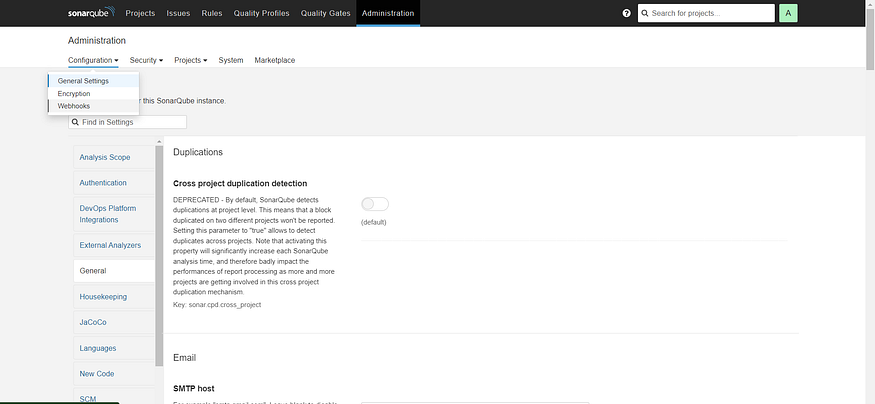
Click on Create
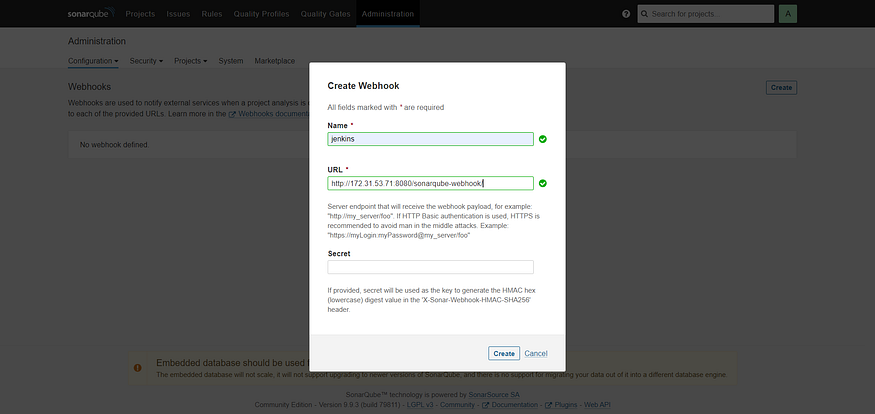
Add details:
<http://jenkins-private-ip:8080>/sonarqube-webhook/
Step 6: Install OWASP Dependency Check Plugins
Go to Dashboard → Manage Jenkins → Plugins → OWASP Dependency-Check. Click on it and install it without restarting.

First, we configured the plugin, and next, we had to configure the Tool
Goto Dashboard → Manage Jenkins → Tools →
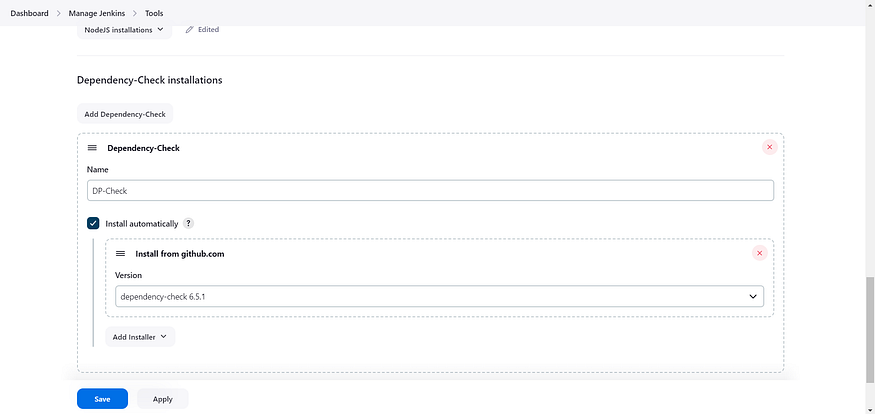
Click on Apply and save here.
Now go to Configure → Pipeline and add this stage to your pipeline and build.
Let’s go to our pipeline and add the script to our pipeline script.
pipeline{
    agent any
    tools{
        jdk 'jdk17'
        nodejs 'node16'
    }
    environment {
        SCANNER_HOME=tool 'sonar-scanner'
    }
    stages {
        stage('clean workspace'){
            steps{
                cleanWs()
            }
        }
        stage('Checkout from Git'){
            steps{
                git branch: 'main', url: 'https://github.com/mudit097/Reddit-Clone-apps.git'
            }
        }
        stage("Sonarqube Analysis "){
            steps{
                withSonarQubeEnv('sonar-server') {
                    sh ''' $SCANNER_HOME/bin/sonar-scanner -Dsonar.projectName=Reddit \
                    -Dsonar.projectKey=Reddit '''
                }
            }
        }
        stage("quality gate"){
           steps {
                script {
                    waitForQualityGate abortPipeline: false, credentialsId: 'Sonar-token'
                }
            }
        }
        stage('Install Dependencies') {
            steps {
                sh "npm install"
            }
        }
        stage('OWASP FS SCAN') {
            steps {
                dependencyCheck additionalArguments: '--scan ./ --disableYarnAudit --disableNodeAudit', odcInstallation: 'DP-Check'
                dependencyCheckPublisher pattern: '**/dependency-check-report.xml'
            }
        }
        stage('TRIVY FS SCAN') {
            steps {
                sh "trivy fs . > trivyfs.txt"
            }
        }
    }
}
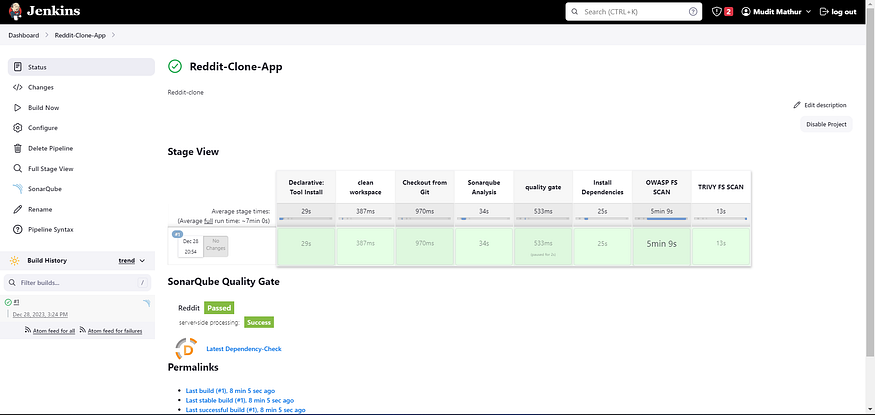
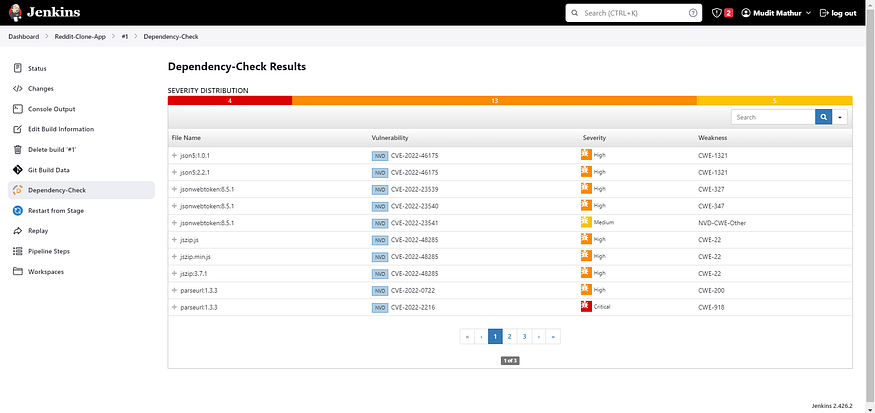
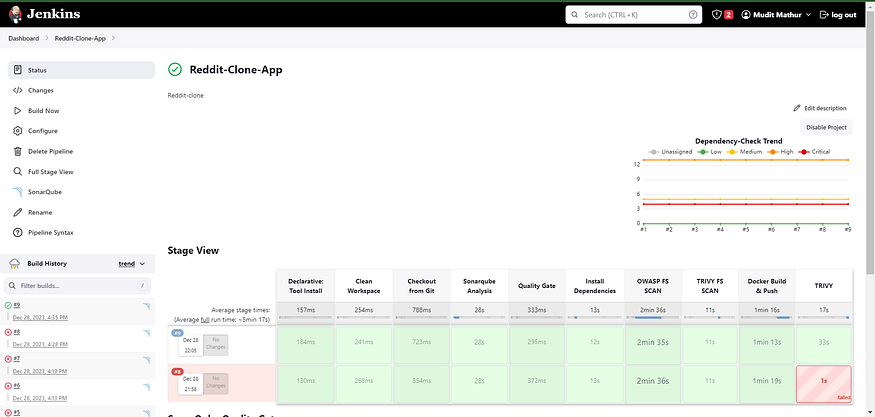
Click on Build now, and you will see the stage view like this:
To see the report, you can go to Sonarqube Server and go to Projects.

You can see the report has been generated, and the status shows as passed. You can see that there are 4.5k lines it has scanned. To see a detailed report, you can go to issues.
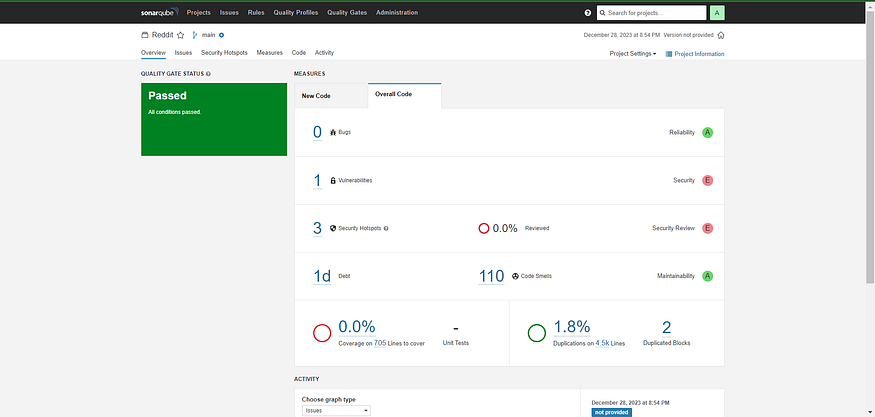
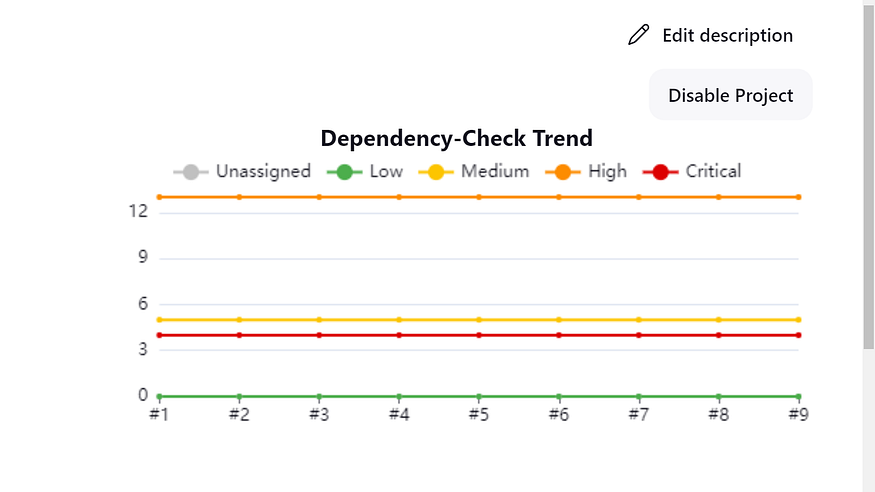
You will see that in status, a graph will also be generated for vulnerabilities and there is an option for dependency checking, as shown below.
Step 7: Docker Image Build and Push
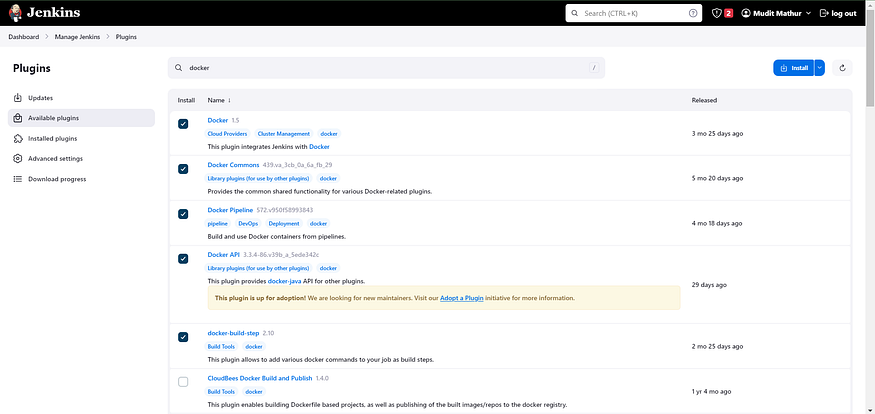
We need to install the Docker tool on our system.
Go to Dashboard → Manage Plugins → Available plugins → Search for Docker and install these plugins.
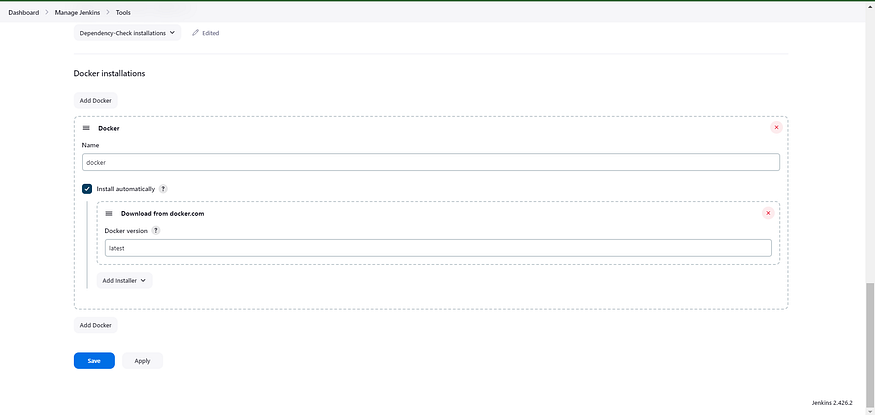
Now, goto Dashboard → Manage Jenkins → Tools →
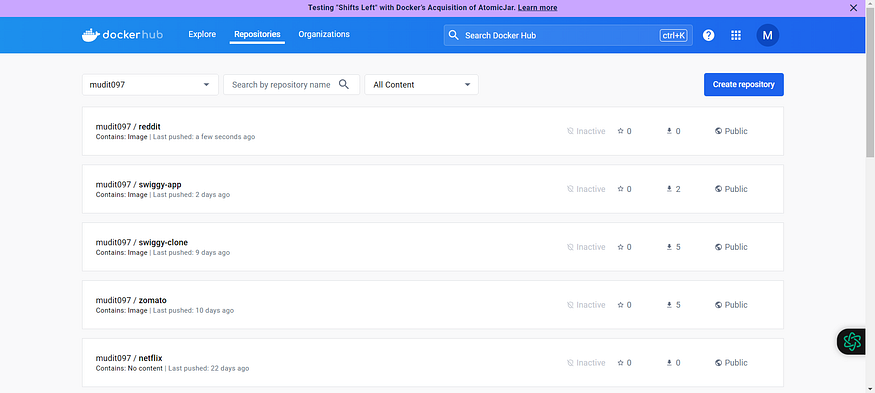
Now go to the Dockerhub repository to generate a token and integrate with Jenkins to push the image to the specific repository.
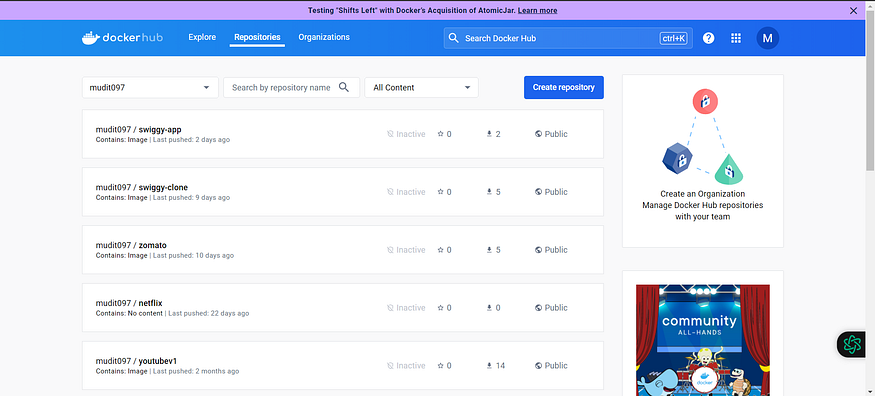
If you observe, there is no repository related to reddit.
There is an icon with the first letter of your name.
Click on that My Account, → Settings → Create a new token and copy the token.

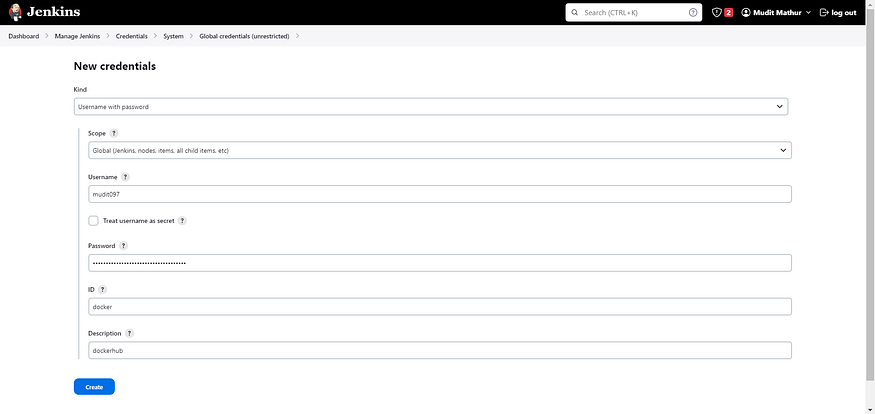
Goto Jenkins Dashboard → Manage Jenkins → Credentials → Add secret text. It should look like this:

Add this stage to Pipeline Script.
stage("Docker Build & Push"){
steps{
script{
withDockerRegistry(credentialsId: 'dockerhub', toolName: 'docker'){
sh "docker build -t reddit ."
sh "docker tag reddit mudit097/reddit:latest "
sh "docker push mudit097/reddit:latest "
}
}
}
}
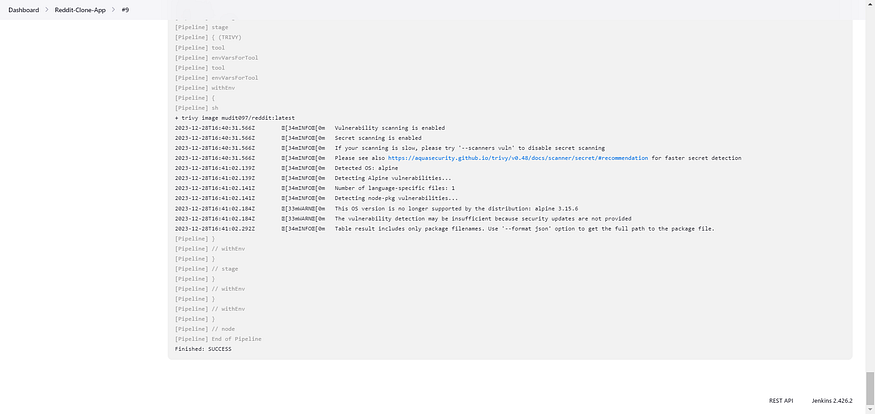
stage("TRIVY"){
steps{
sh "trivy image mudit097/reddit:latest > trivy.txt"
}
}
You will be able to view the output in the Jenkins pipeline and output upon successful execution.

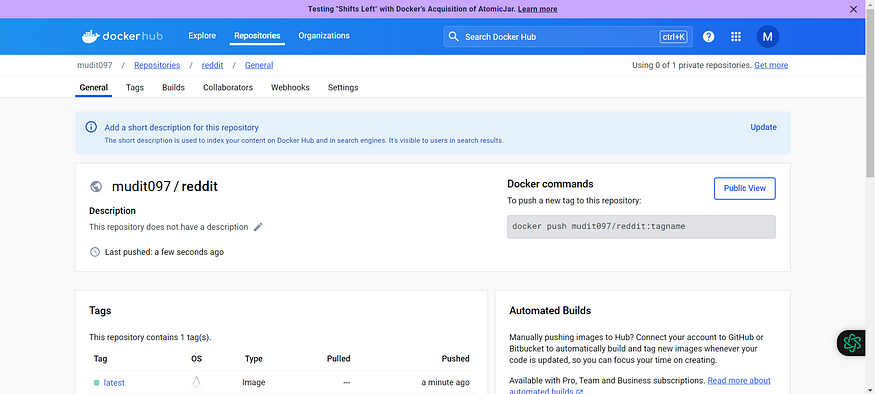
When you log in to Dockerhub, you will see a new image is created.
Step 8: Creation of EKS Cluster with Terraform and ArgoCD Setup
GitHub Link: https://github.com/mudit097/AWS-EKS-TF.git
Below is the structure I used in this demo with the required modules. For storing the state file in a remote bucket.
Below are the bucket details after creating the resources. We are storing our state file in a remote location in a S3 bucket.
terraform init
terraform validate
terraform plan
terraform apply --auto-approve
As we mentioned above, we have successfully stored state files in a remote location.
With the help of the below command, we can update the Kube config in your cli. So that you can be able to use the cluster.
aws eks update-kubeconfig --name <cluster-name> --region <name>
kubectl get nodes
Now let’s install ArgoCD in the EKS Cluster.
kubectl create ns Argocd
# This will create a new namespace, argocd, where Argo CD services and application resources will live.
kubectl create namespace argocd
kubectl apply -n argocd -f https://raw.githubusercontent.com/argoproj/argo-cd/stab
Download Argo CD CLI:
curl -sSL -o argocd-linux-amd64 https://github.com/argoproj/argo-cd/releases/latest/download/argocd-linux-amd64
sudo install -m 555 argocd-linux-amd64 /usr/local/bin/argocd
Access The Argo CD API Server:
By default, the Argo CD API server is not exposed with an external IP. To access the API server,
Choose one of the following techniques to expose the Argo CD API server:
Service Type Load Balancer
Port Forwarding
Let’s go with Service Type Load Balancer.
# Change the argocd-server service type to LoadBalancer.
kubectl patch svc argocd-server -n argocd -p '{"spec": {"type": "LoadBalancer"}}'
List the resources in the namespace:
kubectl get svc -n argocd
kubectl get pods 0n argocd -o wide
Get the load balancer URL:
Pickup the load balancer URL in svc section of argocd-server and paste it into the web to get the UI as shown below image:
Login Using The CLI:
argocd admin initial-password -n argocd
Login with the admin and Password in the above you will get an interface as shown below:
Click on New App:
Application name: your choice
project name: default
Enter the Repository URL, set path to ./, Cluster URL to kubernetes.default.svc, the namespace to default and click save.
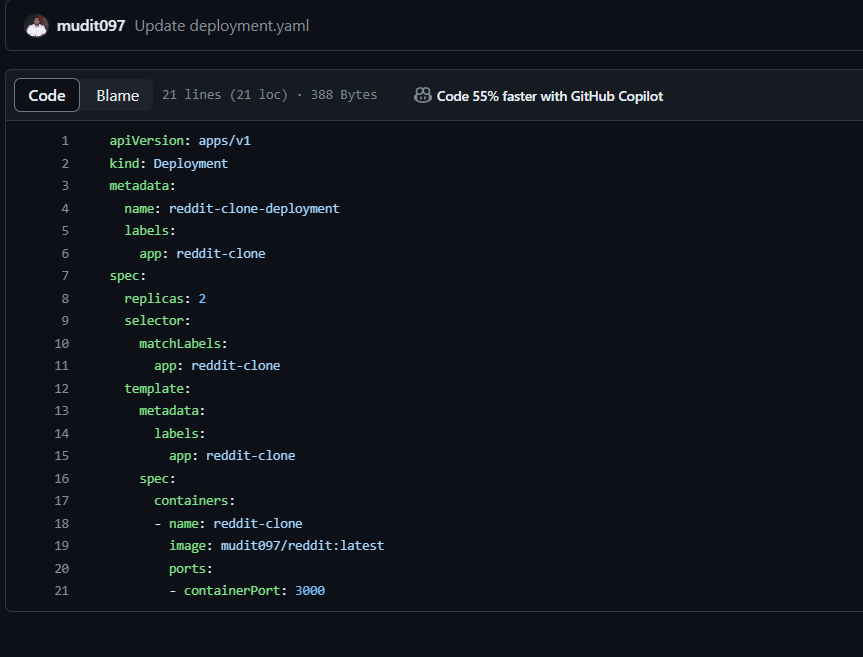
The GitHub URL is the Kubernetes manifest files, which I have stored, and the pushed image is used in the Kubernetes deployment files.
GitHub Link:-https://github.com/mudit097/Reddit-Argocd.git
You should see below once you’re done with the details.
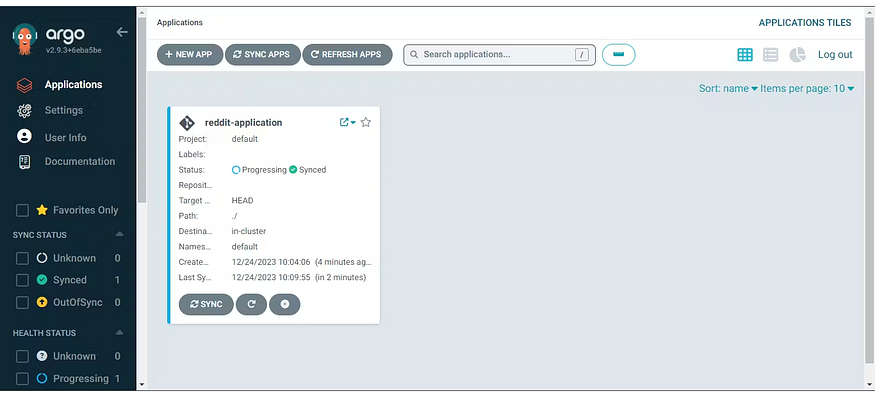
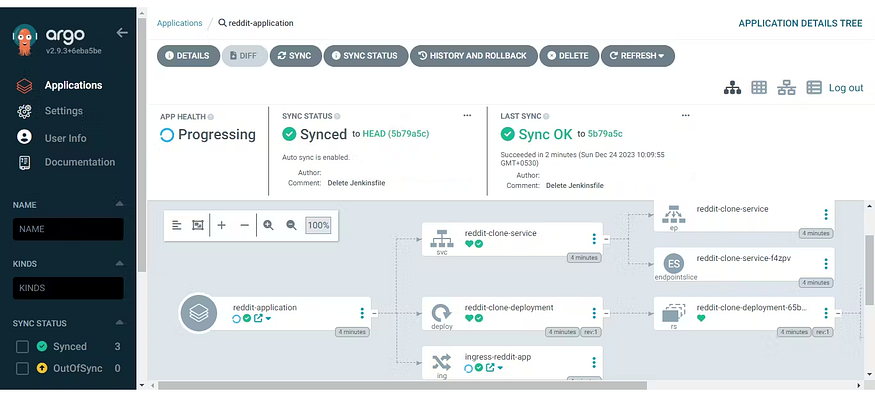
You can see the pods running in the EKS Cluster related to reddit application.
We can see the out-of-pods using the load balancer URL of the Reddit app service. Copy and paste the URL.
With the above load balancer, you will be able to see the output as shown in the below image.
Step 9: Install Helm & Monitoring K8S using Prometheus and Grafana.
On Kubernetes Master, install the helm.
curl -fsSL -o get_helm.sh https://raw.githubusercontent.com/helm/helm/main/scripts/get-helm-3
chmod 700 get_helm.sh
./get_helm.sh
helm version --client
We need to add the Helm Stable Charts for your local client. Execute the below command:
helm repo add stable https://charts.helm.sh/stable
Add Prometheus Helm repo:
helm repo add prometheus-community https://prometheus-community.github.io/helm-charts
Create Prometheus namespace
kubectl create ns prometheus
Install kube-Prometheus-stack:
Below is the command to install kube-prometheus-stack. The helm repo kube-stack-Prometheus (formerly Prometheus-operator) comes with a Grafana deployment embedded.
helm install stable prometheus-community/kube-prometheus-stack -n prometheus
Let’s check if the Prometheus and Grafana pods are running or not
kubectl get all -n prometheus
kubectl get svc -n prometheus
This confirms that Prometheus and Grafana have been installed successfully using Helm.
To make Prometheus and Grafana available outside the cluster, use LoadBalancer or NodePort instead of ClusterIP.
Edit Prometheus Service
kubectl edit svc stable-kube-prometheus-sta-prometheus -n prometheus
Edit Grafana Service
kubectl edit svc stable-grafana -n prometheus
Do the same thing for Grafana.
Verify if the service is changed to LoadBalancer and also get the Load Balancer Ports.
The two services have changed from ClusterIP to Loadbalancer.
Get the Prometheus load balancer URL with port and try as mentioned below.
<loadbalancer>:<port>
Access Grafana UI in the browser
Now we will check from the Grafana end point as well. Try with the load balancer URL, which is enough to check Grafana UI on the web.
Login to Grafana
UserName: admin
Password: prom-operator
Create a Dashboard in Grafana
In Grafana, we can create various kinds of dashboards as per our needs.
How to Create Kubernetes Monitoring Dashboard?
For creating a dashboard to monitor the cluster:
Click the ‘+’ button on the left panel and select ‘Import’.
Enter the 15661 dashboard id under Grafana.com Dashboard.
Click ‘Load’.
Select ‘Prometheus’ as the endpoint under the Prometheus data sources drop-down.
Click ‘Import’.
This will show the monitoring dashboard for all cluster nodes.
How to Create Kubernetes Cluster Monitoring Dashboard?
For creating a dashboard to monitor the cluster:
Click the ‘+’ button on the left panel and select ‘Import’.
Enter 3119 dashboard ID under Grafana.com Dashboard.
Click ‘Load’.
Select ‘Prometheus’ as the endpoint under the Prometheus data sources drop-down.
Click ‘Import’.
This will show the monitoring dashboard for all cluster nodes
Create a POD Monitoring Dashboard
For creating a dashboard to monitor the cluster:
Click the ‘+’ button on the left panel and select ‘Import’.
Enter 6417 dashboard ID under Grafana.com Dashboard.
Click ‘Load’.
Select ‘Prometheus’ as the endpoint under the Prometheus data sources drop-down.
Click ‘Import’.
Step 10: Installation of logging on K8S using ElasticSearch, Fluentd and Kibana.
Step 1: Clone Your GitHub Repository Begin by cloning your GitHub repository containing the EFK manifest files:
git clone https://github.com/mudit097/EFK-Stack.git
Step 2: Navigate to the EFK Directory Move to the EFK directory in your repository to access the manifest files for deployment:
$ ls -la
Step 3: Create EFK Deployment Apply the manifest files to create the EFK stack deployment:
$ kubectl apply -f .
kubectl get all =n efk-stack
Step4: Enable Kibana Security Ensure that port 5601 is enabled in the Kibana Load Balancer for secure access: (Note: Provide instructions specific to your environment for enabling port 5601)
Step 5: Access Kibana URL Open your web browser and access the Kibana URL to interact with the dashboard.
<loadbalancer url>:<port>
Step 6: Create Index Patterns Create index patterns in Kibana by selecting ‘*’ and ‘@timestamp’ to index the log data.
Step 7: Explore Logs in Kibana Now you can explore and analyze your logs through the user-friendly Kibana dashboard.
Conclusion:
The project will demonstrate the deployment of a Reddit clone application in a cloud-native environment using EKS, with automated CI/CD pipelines managed by Jenkins. Additionally, the project will implement monitoring and logging capabilities using Prometheus, Grafana, Elasticsearch, Fluentd, and Kibana, ensuring visibility into the application’s performance and facilitating effective troubleshooting and analysis.
Thank you for reading this post! I hope you find it helpful. If you have any feedback or questions, Please connect with me on LinkedIn at
https://www.linkedin.com/in/mudit--mathur/
mudit097 - Overview
Linux || Docker || AWS || GCP || Azure || Jenkins || K8S || Ansible || Terraform || - mudit097
Your feedback is valuable to me. Thank you!